

Fashion conglomerate G-III (NASDAQ:GIII) fell short of the markets revenue expectations in Q3 CY2025, with sales falling 9% year on year to $988.6 million. The company’s full-year revenue guidance of $2.98 billion at the midpoint came in 1.3% below analysts’ estimates. Its non-GAAP profit of $1.90 per share was 17.9% above analysts’ consensus estimates.
Is now the time to buy G-III? Find out by accessing our full research report, it’s free for active Edge members.
G-III (GIII) Q3 CY2025 Highlights:
- Revenue: $988.6 million vs analyst estimates of $1.01 billion (9% year-on-year decline, 2.3% miss)
- Adjusted EPS: $1.90 vs analyst estimates of $1.61 (17.9% beat)
- Adjusted EBITDA: $124.9 million vs analyst estimates of $111 million (12.6% margin, 12.5% beat)
- The company dropped its revenue guidance for the full year to $2.98 billion at the midpoint from $3.02 billion, a 1.3% decrease
- Management raised its full-year Adjusted EPS guidance to $2.85 at the midpoint, a 7.5% increase
- EBITDA guidance for the full year is $210.5 million at the midpoint, above analyst estimates of $203.7 million
- Operating Margin: 11.4%, down from 15.3% in the same quarter last year
- Market Capitalization: $1.25 billion
Morris Goldfarb, G-III’s Chairman and Chief Executive Officer, said, “We delivered a strong third quarter with gross margins and earnings far exceeding our expectations. This was driven by the strength of our go-forward portfolio, particularly our owned brands, as well as a healthy mix of full-price sales and our mitigation efforts against tariffs. I am pleased with how our brands are resonating with consumers and encouraged by the solid demand we have seen throughout the holiday season to date.”
Company Overview
Founded as a small leather goods business, G-III (NASDAQ:GIII) is a fashion and apparel conglomerate with a diverse portfolio of brands.
Revenue Growth
A company’s long-term sales performance can indicate its overall quality. Even a bad business can shine for one or two quarters, but a top-tier one grows for years. Regrettably, G-III’s sales grew at a weak 5.8% compounded annual growth rate over the last five years. This was below our standard for the consumer discretionary sector and is a tough starting point for our analysis.
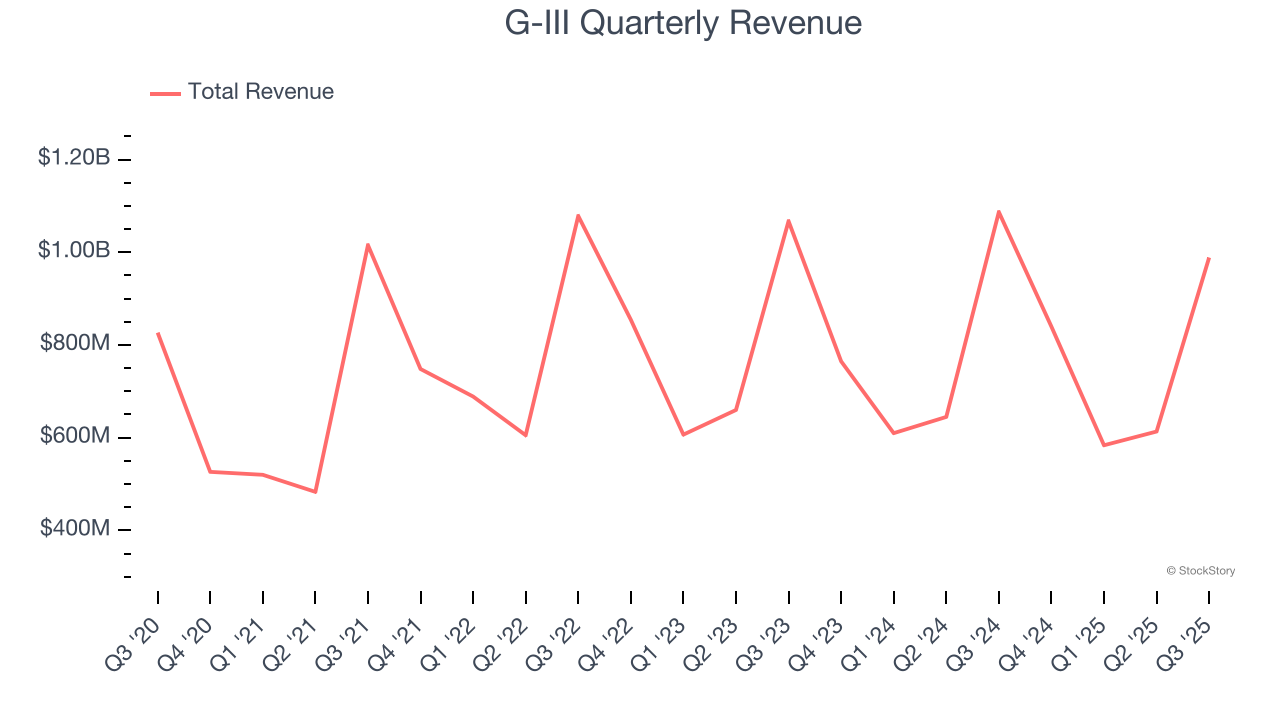
We at StockStory place the most emphasis on long-term growth, but within consumer discretionary, a stretched historical view may miss a company riding a successful new product or trend. G-III’s performance shows it grew in the past but relinquished its gains over the last two years, as its revenue fell by 2.6% annually. 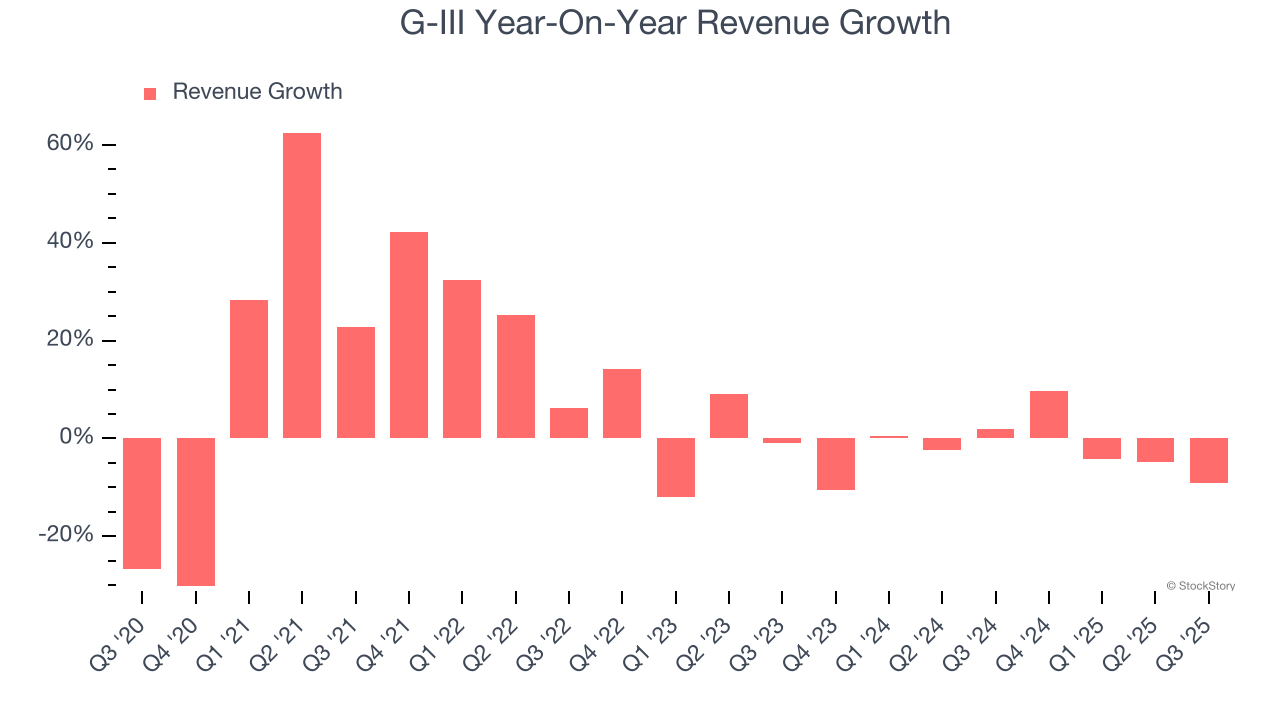
This quarter, G-III missed Wall Street’s estimates and reported a rather uninspiring 9% year-on-year revenue decline, generating $988.6 million of revenue.
Looking ahead, sell-side analysts expect revenue to decline by 2.8% over the next 12 months, similar to its two-year rate. This projection doesn't excite us and implies its newer products and services will not lead to better top-line performance yet.
The 1999 book Gorilla Game predicted Microsoft and Apple would dominate tech before it happened. Its thesis? Identify the platform winners early. Today, enterprise software companies embedding generative AI are becoming the new gorillas. a profitable, fast-growing enterprise software stock that is already riding the automation wave and looking to catch the generative AI next.
Operating Margin
G-III’s operating margin has shrunk over the last 12 months and averaged 7.8% over the last two years. The company’s profitability was mediocre for a consumer discretionary business and shows it couldn’t pass its higher operating expenses onto its customers.
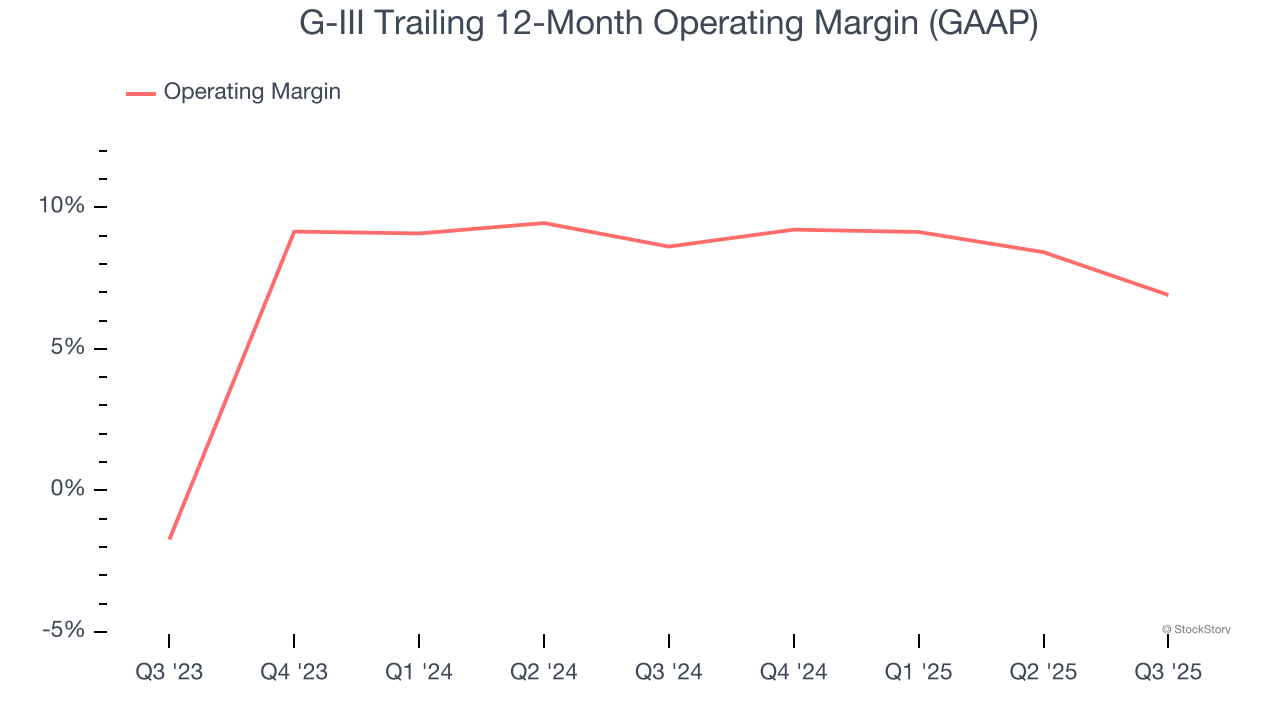
This quarter, G-III generated an operating margin profit margin of 11.4%, down 3.9 percentage points year on year. This contraction shows it was less efficient because its expenses increased relative to its revenue.
Earnings Per Share
Revenue trends explain a company’s historical growth, but the long-term change in earnings per share (EPS) points to the profitability of that growth – for example, a company could inflate its sales through excessive spending on advertising and promotions.
G-III’s EPS grew at a decent 32.3% compounded annual growth rate over the last five years, higher than its 5.8% annualized revenue growth. However, this alone doesn’t tell us much about its business quality because its operating margin didn’t improve.
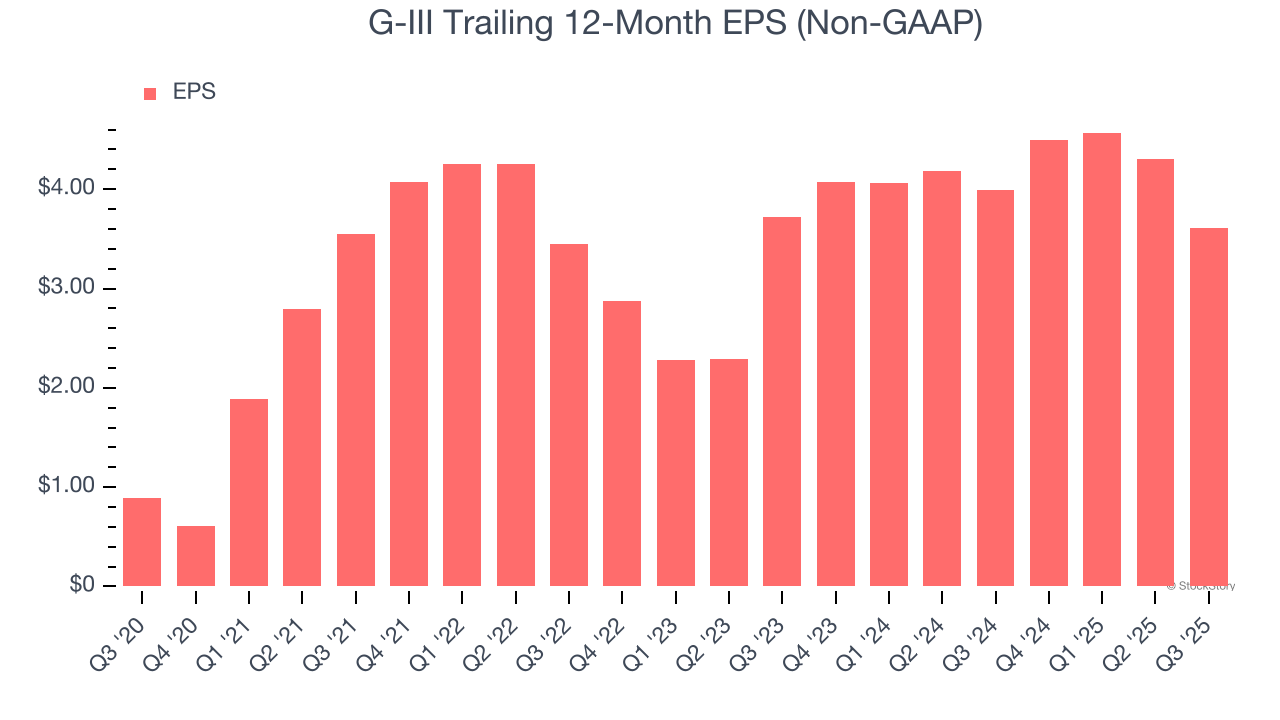
In Q3, G-III reported adjusted EPS of $1.90, down from $2.59 in the same quarter last year. Despite falling year on year, this print easily cleared analysts’ estimates. Over the next 12 months, Wall Street expects G-III’s full-year EPS of $3.61 to shrink by 26%.
Key Takeaways from G-III’s Q3 Results
It was good to see G-III beat analysts’ EPS expectations this quarter. We were also glad its EBITDA outperformed Wall Street’s estimates. On the other hand, its revenue missed and its full-year revenue guidance fell slightly short of Wall Street’s estimates. Zooming out, we think this was a mixed quarter. The stock traded up 10.3% to $32.72 immediately after reporting.
Big picture, is G-III a buy here and now? The latest quarter does matter, but not nearly as much as longer-term fundamentals and valuation, when deciding if the stock is a buy. We cover that in our actionable full research report which you can read here, it’s free for active Edge members.